Architecture

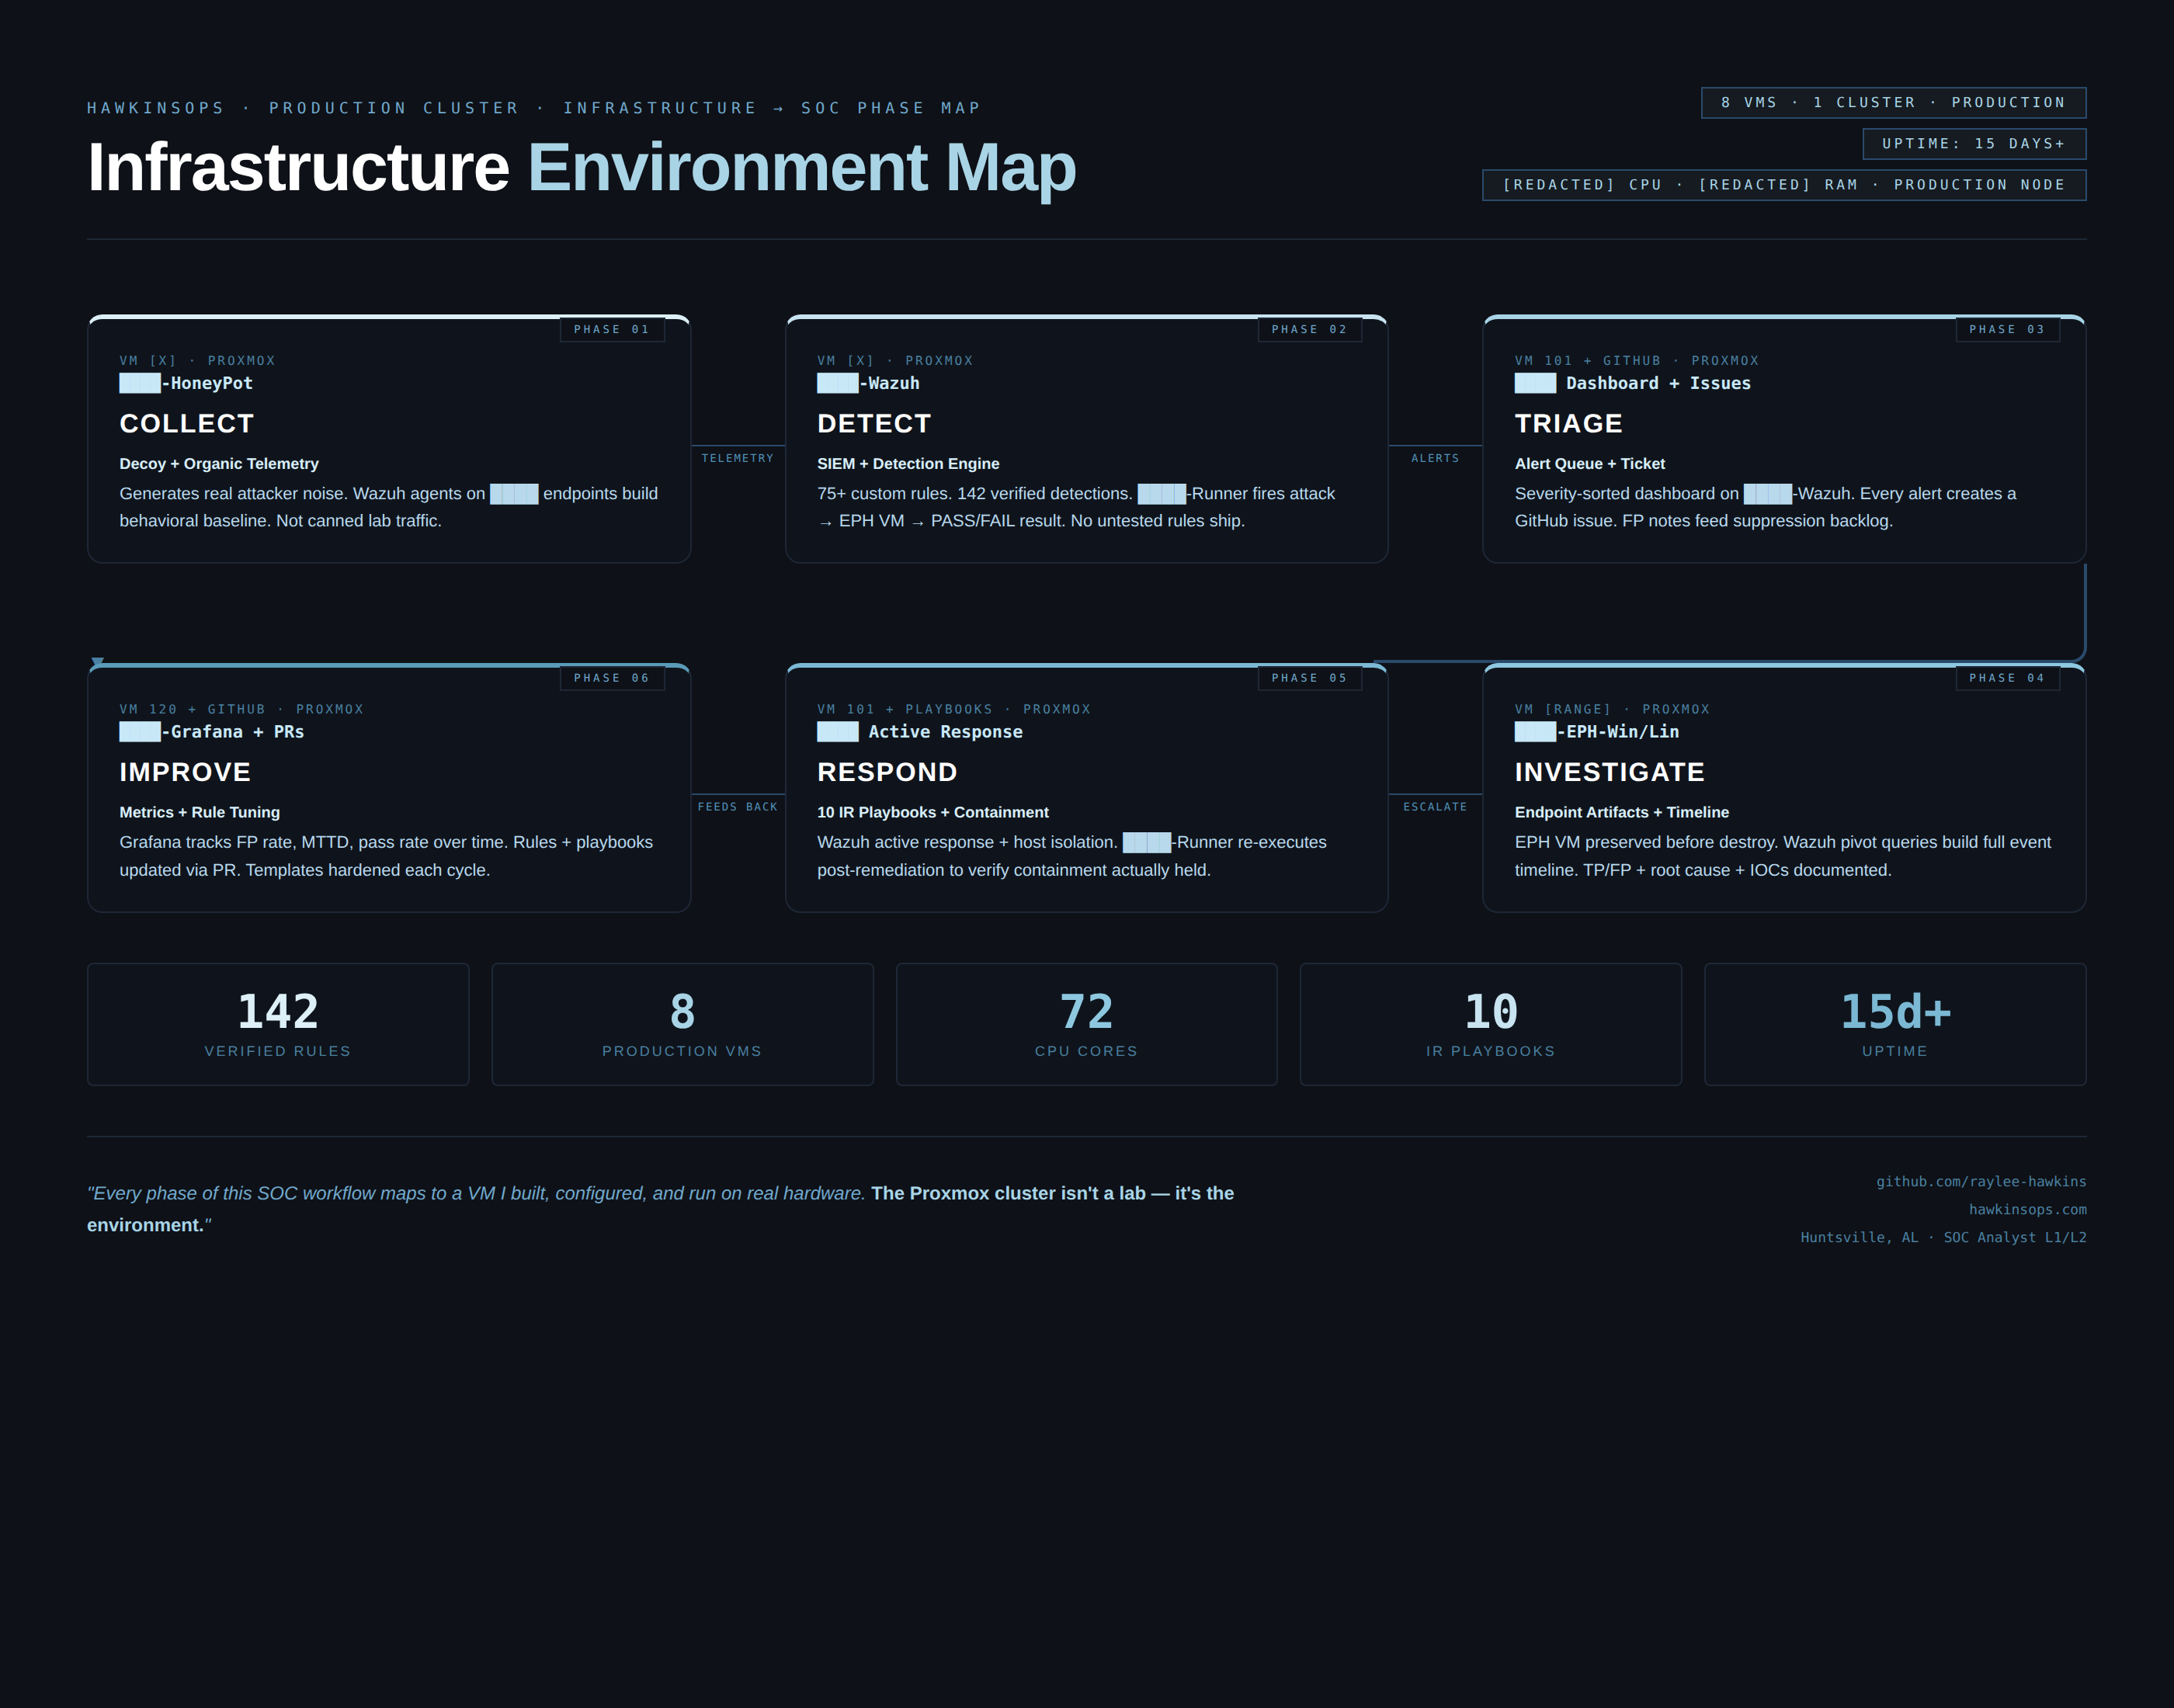
What's running and why

Single Proxmox host running multiple VMs. Windows 11 endpoint feeds Wazuh for detection, Splunk for search and investigation pivots. Everything runs on isolated RFC1918 subnets — test traffic stays in the lab, evidence comes out.

Compute — HO-SR-01
Proxmox hypervisor host. Multiple VMs including Windows 11 endpoint (primary endpoint), Wazuh Manager, and Splunk. Snapshot-driven so detection scenarios are fully repeatable.
ProxmoxMulti-VMSnapshot-driven
Endpoint — Primary Windows system
Windows 11 Enterprise. Primary target for detection scenarios. Wazuh agent installed, Sysmon-ready, log forwarding configured. Real telemetry, real alerts, real artifacts.
Windows 11 EnterpriseWazuh agentSysmon-ready
SIEM — Wazuh
Wazuh Manager + agented endpoints. Handles rule matching, alerting, and FIM. Custom rule IDs in the 100000+ range. Alert levels validated in live detection runs.
Wazuh 4.xCustom rulesFIM enabledAlert tuning
Search — Splunk
Splunk instance for SPL-based detection and investigation pivots. Queries designed around ES-style workflows even without a full ES license.
SplunkSPLES-style pivots
Infrastructure map
Windows 11 endpoint and Proxmox systems wired into a detection-to-response loop. Hardware identifiers intentionally redacted.
SOC lab: Windows 11 endpoint and Proxmox systems wired into a detection-to-response loop
Hardware identifiers intentionally redacted Live environment
Network and Access

Isolated, repeatable, boring in a good way

The lab runs on a private RFC1918 subnet. Isolated from external networks during detection runs. Test traffic stays in the lab. Evidence comes out.

Network layout
Private RFC1918 lab subnet. Wazuh Manager, Splunk, and endpoint VMs communicate internally. Lab-to-internet egress is controlled and monitored.
RFC1918IsolatedControlled egress
Access model
Admin access via Proxmox web console. Wazuh Manager API for rule management. Splunk web UI for SPL investigation. No public exposure of lab services.
Proxmox consoleWazuh APISplunk UI
Simulation

How detection scenarios run

Each detection scenario follows a consistent pattern: trigger the behavior, confirm the alert fires, capture evidence, validate counts. Nothing ships to the repo until the full loop completes.

Trigger → alert → evidence loop
Trigger behavior on the primary endpoint, confirm Wazuh alert fires at expected severity, capture screenshot/log artifact, confirm alert resolves or closes. Snapshot restore between runs for clean slate.
RepeatableEvidence-firstSnapshot restore
Wazuh detection harness
Python tool querying Wazuh Indexer REST API. Validates expected detections fire per ATT&CK technique. Generates pass/fail reports with artifact references.
PythonWazuh Indexer APIPass/fail reports
→ Read detection harness case study
Data flow: endpoint to alert (how logs move)
  1. Primary endpoint generates event (process creation, FIM change, network connection, etc.)
  2. Wazuh agent forwards to Wazuh Manager over encrypted channel
  3. Wazuh Manager evaluates against custom rules (100000+ range)
  4. Alert fires at configured severity level
  5. Alert captured and validated as evidence artifact
  6. Splunk receives forwarded events for SPL pivot layer
Evidence and Artifacts

What's captured and where it lives

Every detection run produces at least one artifact: a screenshot, log snippet, or verification output. Artifacts are sanitized and stored in PROOF_PACK/ alongside counts and evidence checklists.

Proxmox + alert evidence
Redacted Proxmox node screenshots showing VM layout. Wazuh alert screenshots showing rule ID, severity level, and triggering event. No hostnames or IPs in public artifacts.
RedactedPROOF_PACK/Available on request
Verified counts output
CI generates PROOF_PACK/VERIFIED_COUNTS.md on every push. Counts are reproducible by running the verify script against the public repo. No hand-waving required.
CI-generatedReproduciblePROOF_PACK/VERIFIED_COUNTS.md

Redacted examples available on request.

Open proof pack Read SOC integration case study Browse repository